R語言繪製流程圖(一)
作者簡介
作者:吳健 中國科學院大學 R語言、統計學愛好者,尤其擅長R語言和Arcgis在生態領域的應用分享
個人公衆號:統計與編程語言
R語言爲用戶提供了大量的繪圖函數,包括基於圖形語法的ggplot2和傳統繪圖包等。關於上述繪圖函數有大量的介紹材料,大家可以自行查找材料進行學習。
本文介紹R語言中基於低水平繪圖設備(僅能繪製基本圖形)來繪製流程圖。
在第一部分我首先介紹R語言低水平繪圖設備如何來繪製基本圖形,下一期會以這一期的內容爲基礎來繪製一個完整的流程圖,敬請期待。
1.繪製基本圖元文件,並在矩形框中添加文本:
library(grid)
grid.roundrect(width=0.25, height=0.25)
grid.text(“ISBN”)
2.根據視口的方法調整文字在矩形框中的位置
pushViewport(viewport(width=0.25,height=0.125))
grid.roundrect()
grid.text(“ISBN”, x=unit(2,”mm”), y=unit(1.5,’lines’), just=’left’)
grid.text(“title”, x=unit(2,”mm”), y=unit(0.5,”lines”), just=”left”)
popViewport()
3.根據文字大小繪製矩形框的大小
labels <- c(“ISBN”, “title”)
vp <- viewport(width=max(stringWidth(labels))+unit(4,”mm”),
height=unit(length(labels),”lines”))
pushViewport(vp)
grid.roundrect()
grid.text(labels,x=unit(2,”mm”),y=unit(2:1-0.5,’lines’),just=”left”)
popViewport()
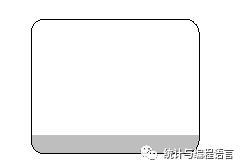
4.採用裁剪的方法繪製陰影(主要思想是先繪製一個灰色矩形框,然後繪製一個在底邊留下一行的相對小一點的白色矩形框)
pushViewport(viewport(width=0.25, height=0.2))
grid.roundrect(gp=gpar(fill=”grey”))
grid.clip(y=unit(1,”lines”),just=”bottom”)
grid.roundrect(gp=gpar(fill=”white”))
popViewport()
5.繪製曲線
5.1根據一系列點繪製曲線
x1 <- c(0.1, 0.2, 0.2)
y1 <- c(0.2, 0.2, 0.8)
grid.xspline(x1, y1)#create a sharp corner at the control
point
x2 <- c(0.4, 0.5, 0.5)
y2 <- c(0.2, 0.2, 0.8)
grid.xspline(x2, y2, shape=-1)#draw a smooth curve through the control
point
x3 <- c(0.7, 0.8, 0.8)
y3 <- c(0.2, 0.2, 0.8)
grid.xspline(x3, y3, shape=1)#draw a smooth curve that passes nearby
5.2根據起點和終點繪製曲線
x1a <- 0.1; x1b <- 0.2
y1a <- 0.2; y1b <- 0.8
grid.curve(x1a, y1a, x1b, y1b)
x2a <- 0.4; x2b <- 0.5
y2a <- 0.2; y2b <- 0.8
grid.curve(x2a, y2a, x2b, y2b,inflect=TRUE)
x3a <- 0.7; x3b <- 0.8
y3a <- 0.2; y3b <- 0.8
grid.curve(x3a, y3a, x3b, y3b,ncp=8, angle=90,square=FALSE,curvature=2,arrow=arrow(angle=15))
6.繪製流程圖基本圖件
labels <- c(“ISBN”, “title”, “pub”)
vp <- viewport(width=max(stringWidth(labels))+unit(4,”mm”), height=unit(length(labels),”lines”))
pushViewport(vp)
grid.roundrect()
grid.clip(y=unit(1,”lines”),just=’bottom’)
grid.roundrect(gp=gpar(fill=’grey’))
grid.clip(y=unit(2,”lines”),just=”bottom”)
grid.roundrect(gp=gpar(fill=”white”))
grid.clip()
grid.text(labels,x=unit(rep(2,3),”mm”),y=unit(3:1-0.5,”lines”),just=”left”)


